
Dear Impact Practitioner,
Have you ever had to quantify the impact your company has on its end clients? Going beyond anecdotal stories, have you had to design a framework and data collection method that lets you speak reliably about the changes, positive and negative, your clients are experiencing?
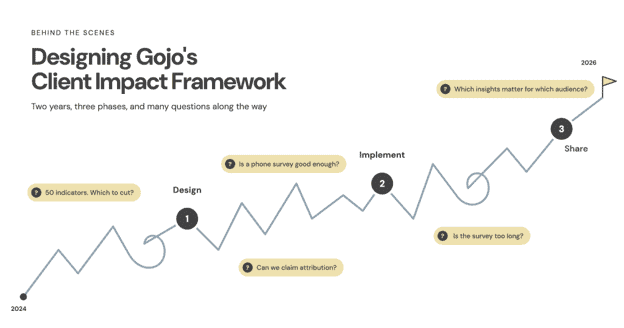
Gojo's impact team was in that spot in 2024. Until then, our impact measurement focused on the outreach (who we serve) and quality (how clients experience our products and services) of our work, through tools like Client Satisfaction and Exit Surveys, with only a light touch on outcomes, the actual changes in clients’ lives. But as an impact team hungry to quantify our impact, we set out to answer: "What is Gojo's impact?" Over the last two years, we developed our own framework and implemented it in five countries.
While designing our framework, I felt like I was walking through uncertain territory, with very few people talking about their challenges and lessons. So today I write this primarily for you, my colleagues on a similar journey, as your impact practitioner next door, candidly sharing my lessons to make your journey a little easier. To make it easier to digest, I've broken the project into three phases, each with its own challenges and lessons:
- Design: Defining the framework and methodology
- Implement: Running the survey in the field
- Share: Analysing the data and reporting to stakeholders
1. Design: Defining the framework and methodology
We began by asking: what have others already done that we can learn from? We spoke to other practitioners and reviewed impact reports and survey tools from the World Bank, CGAP, 60 Decibels, Oikocredit, FINCA and Cerise+SPTF. From this, we built a list of indicators across Outreach, Quality and Outcomes. Our first list had 50 indicators, with 17 of them on outcomes!
"I wish we could learn everything about our clients and how we impacted their lives!" is how I would capture our team's energy at that stage. We listed everything: how clients used their loans, the challenges they faced, their ability to save and cope with emergencies, their confidence managing finances, their optimism about the future, and changes in their meals, education, sanitation and housing.
Curiosity was our best friend at this stage. Although we knew our list was long, we didn't rush to edit ourselves. Since most Outreach and Quality indicators could come from data we already had, we spent the next several months on the outcomes indicators and on designing a data collection methodology from scratch.
We designed a questionnaire around the indicators and piloted it in Sri Lanka, alongside an internal offsite. First, we got feedback from the Impact and SEPM (Social and Environmental Performance Management) leads of our group companies. They are the champions of social performance, and they know how both their clients and their management think. They helped us see which questions were relevant to their social goals, useful for taking action, easy for clients to understand, and comparable over time. Then a team of five from Gojo split into two groups and interviewed seven clients in person. We wanted to test whether our questions captured what clients were experiencing, and whether clients understood them easily.

Our pilot team in Sri Lanka
We came back with Version 2 of the questionnaire, now with 11 outcome indicators. But we didn’t stop there. Since the final survey would be run by call centre agents at each group company, we ran a second pilot by phone: the call centre at Sejaya, our group company in Sri Lanka, spoke to 20 clients. We were testing usability. How did the survey feel over the phone? How long did it take? Could we analyse the responses meaningfully? Which questions would we cut?
The answer was clear: our survey was too long. Curiosity is what drives us to search for insights, but left unchecked, it can make outcomes measurement impractical.
So we applied an 80/20 rule. The primary purpose of the survey was to identify actionable insights; the secondary goal was to learn more about clients. That meant 80% of questions had to be relevant, useful and actionable, and only 20% could be nice-to-know. Whether clients could spend on wants or assets, for example, was deprioritised. An overall sense of quality-of-life change was relevant and useful, but detail on sanitation, housing and education was nice-to-know. We also kept the impact survey separate from the Client Satisfaction Survey, to avoid survey fatigue for clients and minimise drop-offs.
With ruthless editing and several debates, we arrived at 8 outcome indicators and 25 indicators in total. The Impact Committee, a sub-committee of Gojo’s Board, gave us the green signal, and we moved on to phases 2 and 3 in 2025.
Throughout this phase, I grappled with two big questions:
- Is a telephonic survey with a sample size of 300-400 per company on client outcomes really good enough?
- How can we attribute clients' outcomes to our financial products and services?
Both were resolved through conversations with others. Cécile Lapenu from Cerise+SPTF reassured me in one of our catch-ups that outcomes measurement need not be elaborate to be useful. That nudged me towards good-enough measurement over the most perfect or comprehensive one.
Attribution was the tougher dilemma, and Ging Ledesma from Oikocredit inspired me there. At a 2024 Cerise+SPTF panel in the Philippines, someone asked how Oikocredit could claim the impact captured in its "Client Self-perception Survey" as its own. She said that what they capture is the client's self-perception: if a client says Oikocredit impacted them, they take the client's voice at face value.
Our Impact Committee agreed that proving attribution through Randomised Controlled Trials (RCTs), which compare clients against a similar group who didn’t receive the service, would defeat our objective. We wanted lean data that was quick and low-cost to collect, to influence strategic decisions and operational improvements. So instead of trying to prove attribution, we spent our energy on capturing high-quality lean data through rigorous training to minimise bias. We then cross-checked the findings against our group companies’ Management Information System (MIS) data, i.e. their internal client and loan records, or other survey data where available.
2. Implement: Running the survey in the field
With early conviction in our approach, we ran our very first impact survey at five of our majority-owned group companies, in five countries, using the same standardised training for all of them.
We built a Google Form with a built-in script, so agents could read out exactly what was needed and mark answers as they went. Google Forms was free and already familiar to our group companies. We translated the questionnaire into local languages. We trained the Impact leads, who in turn trained their call centre agents. The agents then practised through role-plays in Google Meet breakout rooms, surveying a fictitious client played by the SEPM lead or a fellow agent.
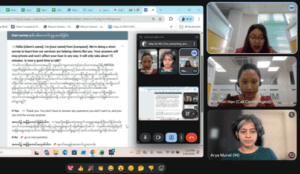
Our online role-play-based training
These sessions demanded a lot of coordination, but they taught us a lot about how questions were received. In Myanmar, we learned that clients are hesitant to share their incomes or debt obligations over the phone, for fear of telephonic scams. This meant accepting ranges or estimates instead of exact numbers, or relying on MIS data. We also learned how daunting “why” questions were: “Why did your income change?” felt much harder for clients to answer than “How did your income change?”
The biggest lesson came from how hard the survey was for agents to fill out. Initially, we required several verbatim answers, with agents typing out clients’ responses word for word. This stretched the survey to 25 minutes. Thankfully, our pilots caught this, and we brought it down to about 15 minutes.
Once again, our unchecked curiosity was running the show! The lesson here was to choose where you need detail and where a standardised five-point scale (say, from “very much decreased” to “very much increased”) will do. Too much detail exhausts clients; too little makes it harder to get the nuance behind their responses.
3. Share: Analysing the data and reporting to stakeholders
With 1,600+ responses in hand, the final phase was cleaning, analysing and reporting. All this data collection is only as good as its analysis and adoption. Our group companies analysed their own data, while Gojo did a portfolio-level analysis across all five companies, segmented by loan type, gender and income level, amongst others. We presented this to Gojo’s Executive Committee and the Impact Committee.
We also presented a one-page summary of each company’s top insights in monthly business review meetings. These focused 15-minute discussions captured CEOs’ attention: some companies identified short-term solutions, while for others, the survey offered a new strategic direction worth considering. Either way, all the CEOs said that the data was a realistic snapshot of their clients’ lives, as they knew them. That was the biggest validation of our efforts.
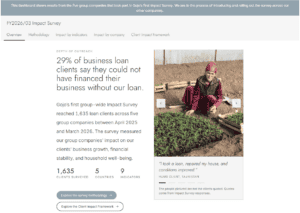
A snapshot of our impact dashboard
Finally, we shared the findings with the rest of the world, including you. We published the numbers in our September 2026 impact report and built an interactive Impact Dashboard. Explore it, and I think you’ll really see the potential of this data. We’ve also planned a webinar on October 29th to dive deeper. Join us by registering here.
In the end, we had at least eight versions of the data analysis, tailored to different stakeholders. That sounds excessive, but each audience needed its own message. As impact professionals, we can easily become married to a single way of presenting our analysis. But to drive adoption, we must see ourselves as storytellers who use data to inspire action in ways that are relevant and interesting to our stakeholders.
–
Looking back, I see how we broke a complex project into manageable phases and focused on one phase at a time. I see how we used design thinking repeatedly, running tiny experiments that kept our curiosity in check and helped us settle for good-enough over perfect. Finally, I see how we took many stakeholders along to the finish line: our immediate team, executive leadership, and the local teams who implemented the survey and acted on its findings.
If you find yourself in any of these phases, I hope you take comfort in knowing that it took us two good years and several iterations to design, measure and share our results. This work takes time and deep thinking, and it is totally normal to not have all the answers. What helps is having the right people around you.
That brings me to my wonderful colleagues: Haruna, Rania, Mayu, Mercy, Cheriel, Mohini, Arisa, all the Impact leads, and Gojo’s Executive Committee and Board members, who each shaped, chiselled and sharpened this framework. Thank you for all your timely support and guidance, without which we would not be here.
Impact measurement is never a destination, but a journey of continuous learning. We have arrived at a milestone, but there are many more discoveries to make, and I will keep sharing my learnings with all of you.
Thanks for staying with me this far. I hope you check out our work and pass on your feedback to me at info@gojo.co. If you feel we can support you in designing your own impact framework, please do reach out!
Your impact practitioner next door,
Arya Murali
Impact Lead, Gojo & Company